Active R&D — V0.1 Blueprint
AEG GRID
A modular smart-power and energy monitoring system: a compact hardware device paired with a live web dashboard that tracks how electricity is used across a lab, workspace or building. Voltage, current, power consumption, energy over time, temperature, battery status and abnormal electrical activity — measured, transmitted, visualized and understood. The first prototype is strictly low-voltage and safely isolated; the roadmap scales to building-wide monitoring.
Sensing
Voltage / Current / Temp
Pipeline
Edge → Backend → Dashboard
Roadmap
GRID 1 → GRID Pro
“Measure. Transmit. Visualize. Understand. Improve.”
Anderson Innovations — GRID Program Philosophy
What GRID Monitors
Raw measurements, turned into operational clarity
Electrical
Voltage and current on a safe low-voltage test system, with power consumption and energy usage estimated and accumulated over time.
Environmental & System
Temperature, device status, uptime, connection state and battery level — every reading timestamped with a clear unit for historical analysis.
Events & Alerts
Threshold alerts and abnormal electrical activity surface immediately, converting raw sensor streams into actionable signal.
Live Statistics
A real-time dashboard shows current load, energy today and this week, system temperature, connected devices and fleet status at a glance.
System Architecture
Sensors → Controller → Network → Backend → Dashboard
Sensing & Control
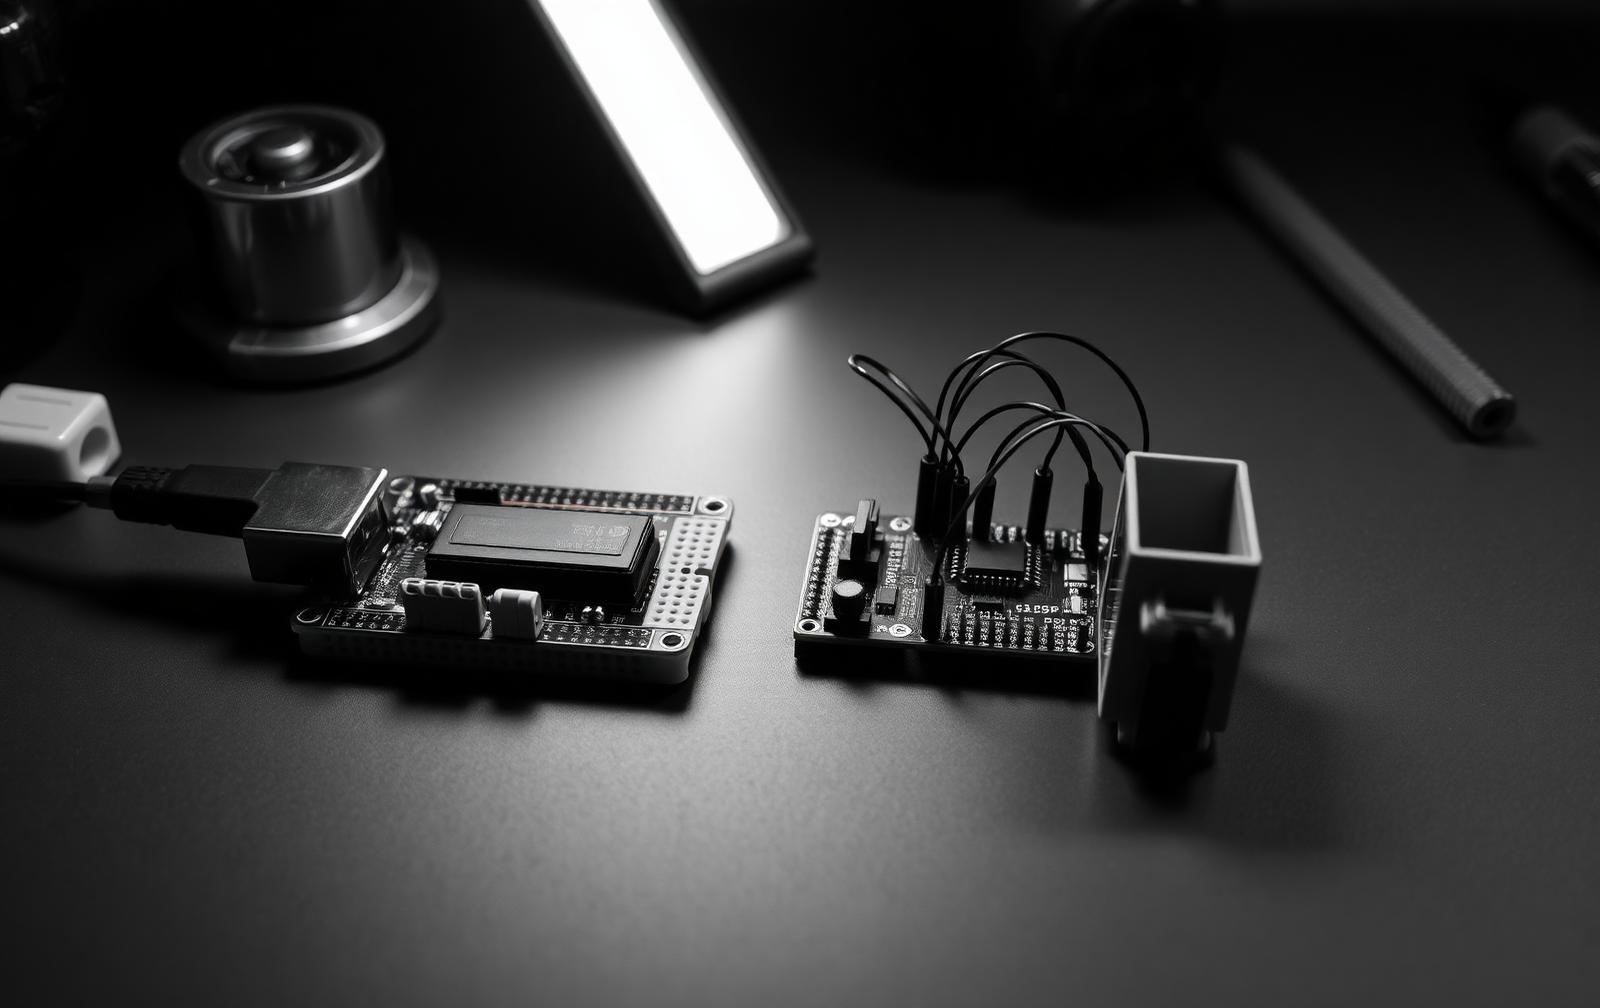
Isolated low-voltage sensors feed a microcontroller development board that samples, timestamps and packetizes every measurement.
Backend & Data
Measurements stream over Wi-Fi to a small service that stores the time series — the network treated as transport, the data model built for later analytics.
GRID Dashboard
A web interface renders live readings, history and device status: current load as a percentage of threshold, daily and weekly energy, temperature and active alerts.
Physical Product
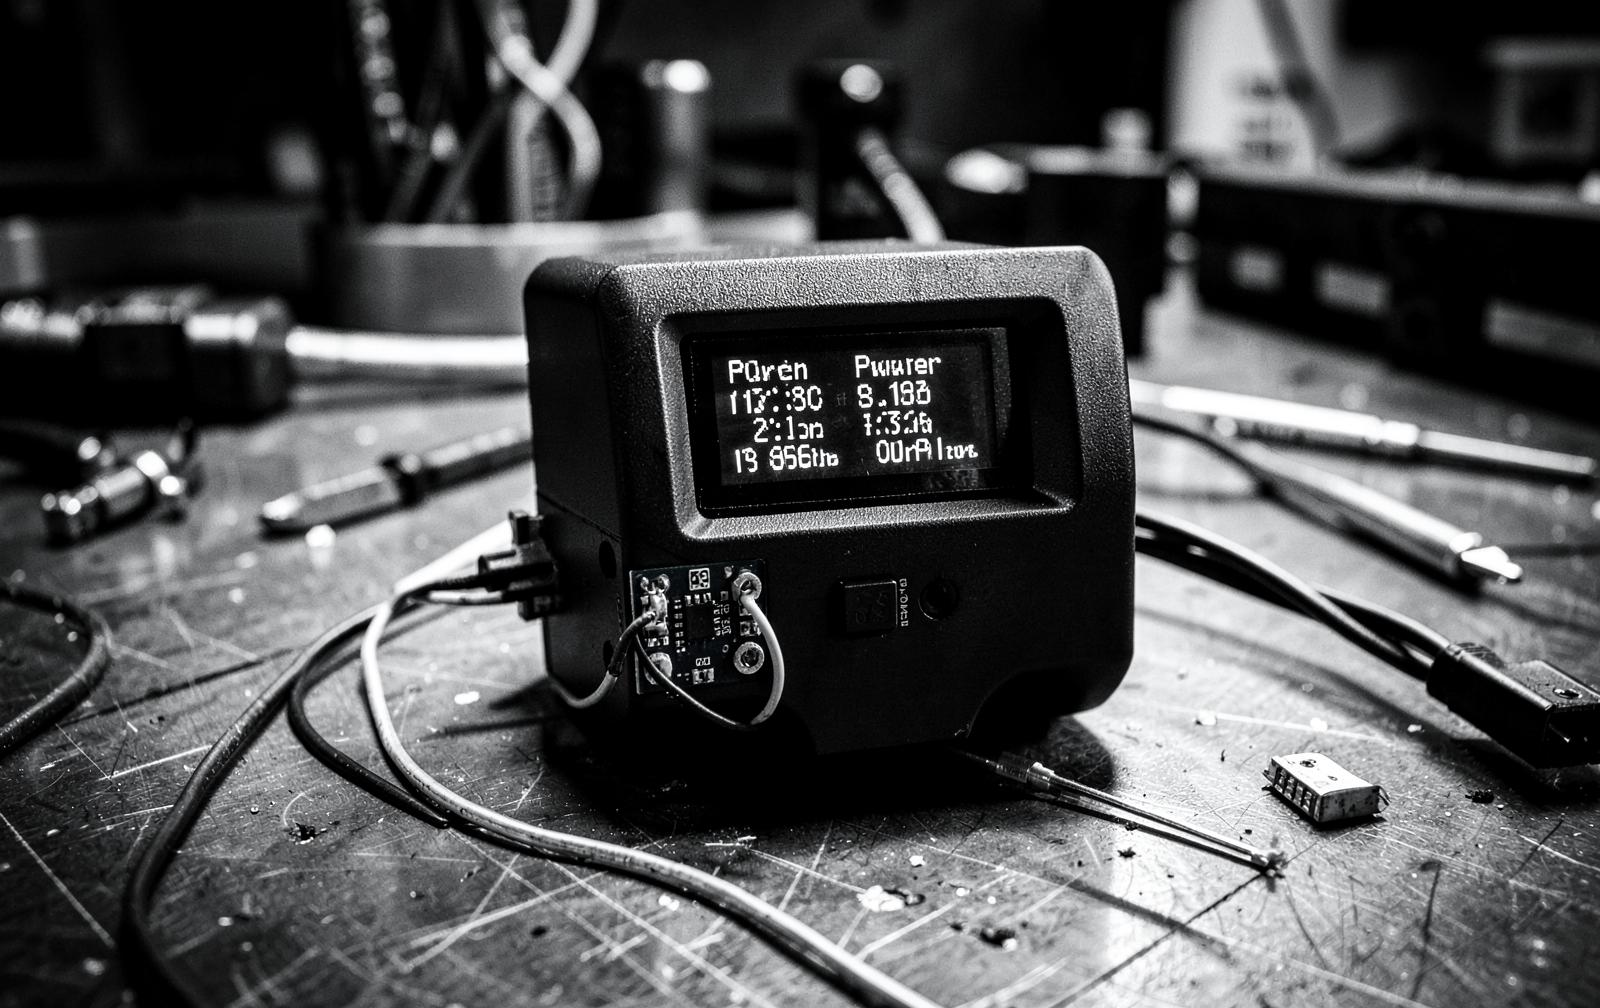
A simple prototype enclosure first, then a full CAD-designed housing — with a long-term path to a custom PCB and documented validation.
Development Roadmap
Phase-gated from bench to pilot
Phase 0–1 — Research & Proof of Concept
Define the low-voltage test setup, sensors, data model and requirements; then read one or more sensors and display live values locally.
Phase 2–3 — Connected Prototype & Dashboard
Transmit measurements to a backend; deliver live charts, device status and historical data in the GRID dashboard.
Phase 4–5 — Enclosure & Validation
CAD model and physical enclosure, followed by repeatable tests, error tracking and full documentation.
Phase 6 — Pilot
A small, controlled deployment with permission — the first fielded GRID node.
Product Line
One platform, scaling by module
GRID 1 & GRID 2
GRID 1 is the basic energy monitor; GRID 2 adds multi-device monitoring and improved analytics.
GRID 3
Building-scale monitoring with modular sensor nodes distributed across a facility.
GRID Pro
Commercial and industrial monitoring: team accounts, reporting, alerts and integrations.
Long-Term Hardware
Professionally designed electronics, a custom PCB, a refined enclosure and documented validation — a manufactured product, not a demo.
Dashboard Concept — Interface Preview
Current Load
82%
Today
12.4 kWh
This Week
78.2 kWh
System Temperature
31°C
Connected Devices
- Laboratory PC
- Lighting
- Equipment
Status
Normal
0 active alerts
Interface values shown are illustrative examples, not target specifications.
Program Documentation
PDFAEG GRID — Project Blueprint V0.1PDF — Download / PreviewPDFProgram Footage
Bench footage — reserved for the first powered sensor-to-dashboard demonstration.